Description and short video of the Quick Filter View functionality and how to use it.
In this article we will explain what the quick filter view is and how it can be used.
Whenever you search something in the Home Page the results for it are compiled in the Quick Filter View. Displaying a summary of results like this allows you to keep just the relevant data you want to work with.
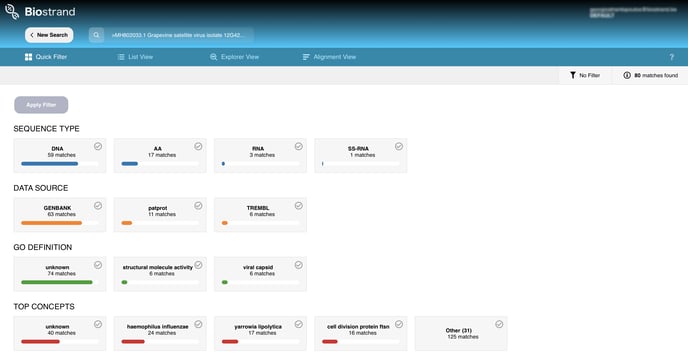
You can see your search query sitting at the top, right above the View panel containing 4 buttons. These buttons allow you to switch between different ways to analyse or view your search results. Presently, you are on the Quick Filter View.
Here, we display cards that contain a variety of data related to your search query. You may un-select the type of data you are not interested in by clicking that card. By default, every card is selected. To quickly select one card within a concept, double click on it.
In each row respectively, the cards display domain information related to either of Data Source or Sequence Type or High Level Ontology, along with the number of matches your query had in that domain. A visual representation of the fraction of results from this domain is present in the colorful bar under this number.
- Data Source: In the first row of cards, BioStrand displays the databases it scanned to arrive at the search results. (You can see the list of public databases we have in our repository in Appendix below)
- Sequence Type: Next, we find a row dedicated to the omics portion that relates to our search query. The sequence type may be DNA, amino acids (AA) or different types of RNA like mRNA, tRNA, lncRNA, miRNA, etc.
- Gene Ontology: This is a row of cards that connects all ontology/annotation information that assists our search results.
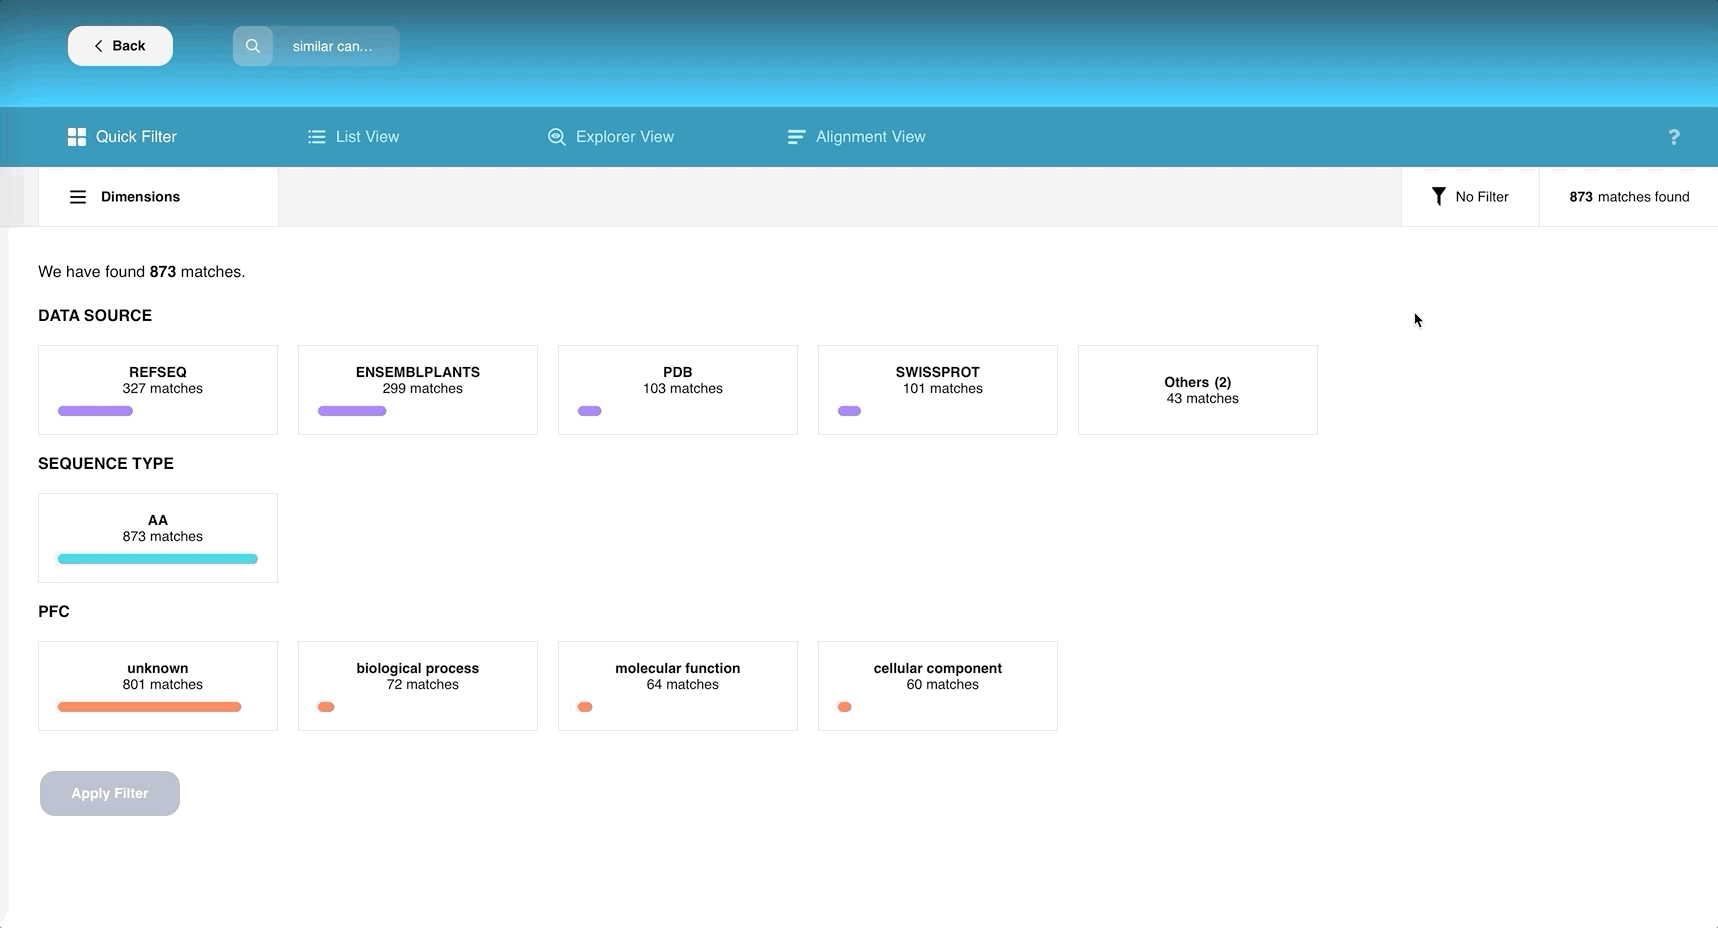
The search results mapped to your search query can go through two more rounds of slicing and dicing using the buttons “Dimensions” and “Filters” in Quick Filter Page. They correspond to high level and low level filtration techniques respectively. The features on this page represent aggregated quality of the data.
Aggregated features, or dimensions, are common aspects for all the search results that can be manipulated to filter the final list of results.
Dimensions are high level concepts like source database or sequence type while Filter is more specific like CATH annotation or gene ontology information related to particular sequences that can be filtered at this point. Once some changes are applied, you can see more or less cards on the screen depending on the chosen Dimensions or Filters.
Filters can be applied in the following way:
Taxonomy field:
The Taxonomy field is built based on an hierarchical structure and each of its branches can be selected as a filter. To select multiple taxonomic branches, hold shift while clicking on the item of choice. Using the slider on the right of the Taxonomy dimension, you can zoom in to see collapsed descriptions.
See a video below:
Note, these search results can be re-opened using the URL you have on this page right now. It contains a unique ID called context, which lets us save your filtering process for you.